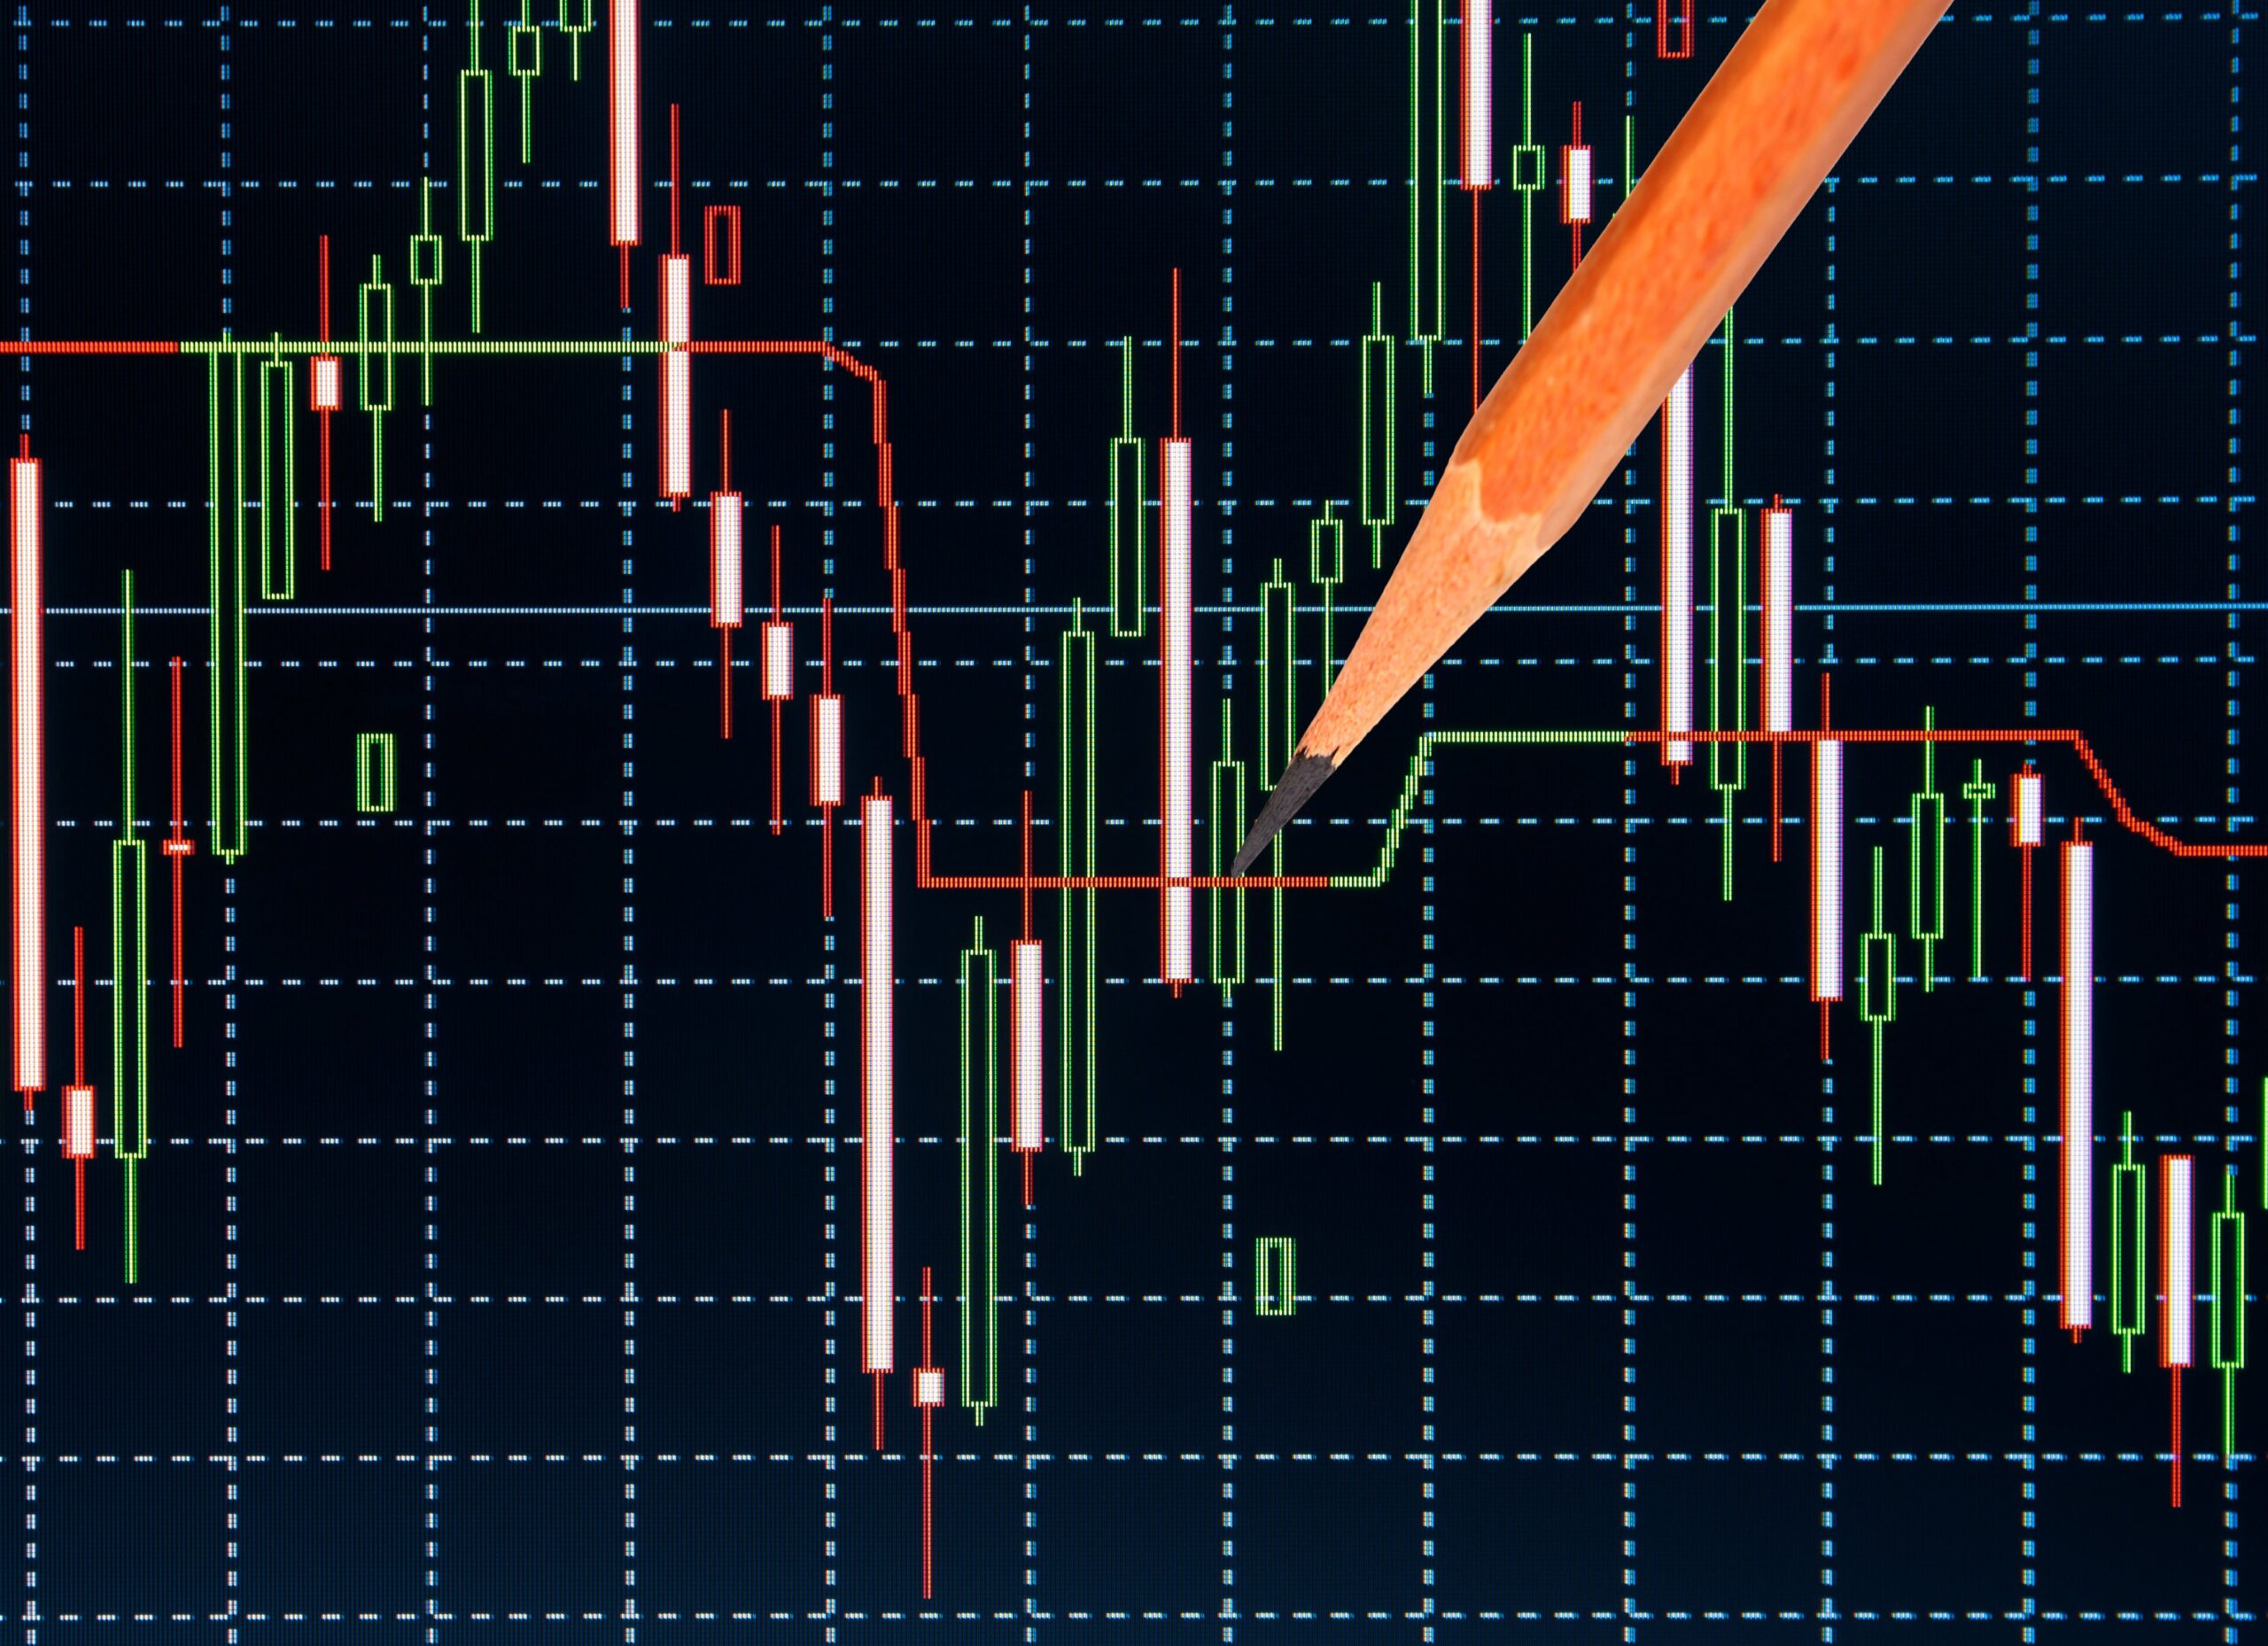
Candlestick charts are among the most widely used tools in trading. They display price movement in a way that reveals market psychology, making them a favorite of both beginners and professionals. Recognizing key candlestick patterns helps traders anticipate reversals, continuations, and momentum shifts with greater confidence, which is especially useful for those exploring opportunities on our forex trading page.
Why Candlestick Patterns Matter
Candlestick analysis is powerful because it compresses market sentiment into simple visual signals. Each pattern reflects the balance of buyers and sellers. Benefits of using candlestick patterns include:
- Easy-to-read signals compared to line charts
- Ability to identify reversals and continuations quickly
- Useful across all markets and timeframes
- Complements technical indicators for stronger analysis
Here’s why candlestick analysis remains a cornerstone of trading strategies:
Single-Candle Patterns
Some of the most useful insights come from individual candles.
Learn about the most common single-candle patterns:
- Doji: Indicates indecision; may signal reversal if found at market extremes
- Hammer: Long lower wick showing rejection of lower prices, often bullish
- Shooting Star: Long upper wick showing rejection of higher prices, often bearish
- Marubozu: Strong candle without wicks, signaling powerful momentum
Note: A single candlestick should be read in context of broader market conditions, not in isolation, to avoid false signals.
Double-Candle Patterns
Two-candle formations provide stronger confirmation than single candles.
Here are two important candle trading chart patterns:
- Engulfing Pattern: Large candle fully engulfs the previous one; bullish or bearish depending on direction
- Piercing Line: A bullish candle that closes above the midpoint of a previous bearish candle
- Dark Cloud Cover: A bearish candle that closes below the midpoint of a previous bullish candle
Tip: Engulfing patterns are more reliable when they appear near strong support or resistance levels. They are also highly effective when combined with volatility trading strategies to capture sharp price swings.
Triple-Candle Patterns
Three-candle sequences often provide some of the most reliable trading signals.
Learn about the three most common candlestick patterns:
- Morning Star: Bullish reversal pattern signaling the end of a downtrend
- Evening Star: Bearish reversal pattern signaling the end of an uptrend
- Three White Soldiers: Three consecutive bullish candles, suggesting strong momentum
- Three Black Crows: Three consecutive bearish candles, signaling a potential downturn
Note: Multi-candle patterns are stronger because they show sustained sentiment over multiple sessions.
Candlestick Analysis in Practice
Candlestick analysis works best when combined with technical tools. For example, using candlestick patterns alongside RSI or moving averages improves accuracy.
Here are ways traders apply candlestick analysis effectively:
- Confirm reversals at support and resistance zones
- Use patterns to time entries within broader trends, applying them alongside market condition–based strategies.
- Combine with volume analysis to validate signals
- Apply in multiple timeframes for confirmation
Tip: Candlestick patterns are not foolproof; combining them with indicators and risk management creates stronger setups.
Steps to Learn Candlestick Trading
Here’s a structured approach for mastering candlestick trading:
- Start by memorizing a few major patterns like doji, engulfing, and morning star
- Practice spotting patterns on demo charts daily
- Combine candlesticks with at least one technical indicator
- Record trades in a journal to track success rates
Note: Mastery comes from repetition — the more you review charts, the faster patterns become second nature.
Conclusion
Candlesticks compress price action into powerful visual signals that reveal market psychology. By learning the most common candlestick patterns, applying them within trading chart patterns, and practicing consistent candlestick analysis, traders gain an edge in timing entries and exits. Combined with indicators and discipline, candlesticks remain one of the most practical tools in every trader’s toolkit, whether applied in traditional assets or the crypto trading market.